Don’t just observe where the business is heading, but proactively guide the operations with reliable information.
Compile all the reports you need
Create reports easily on your own or utilize dozens of ready-made report templates. Share the reports with everyone who needs them.
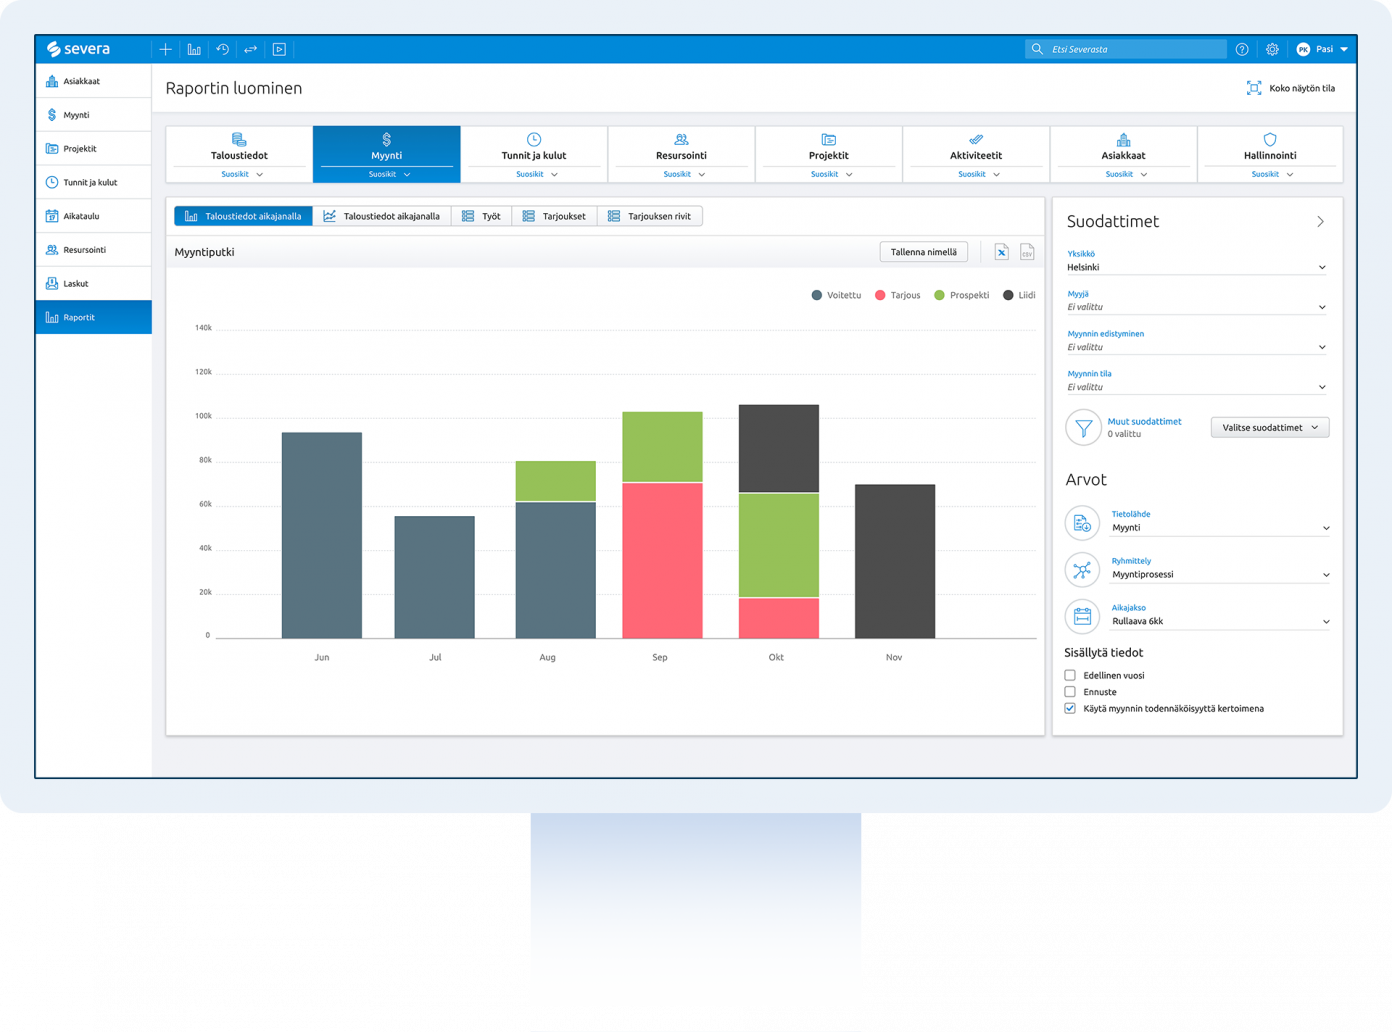
Create visual views
See data as graphs, list and matrix reports. Add the most important reports to your own desktop for immediate access.
Compile information freely
Examine data based on teams, resources, customers, billing volume, or profitability. Define time periods, specification accuracy, and key performance indicators.
Compare, combine, and predict
Analyze data as deeply as you wish. Grasp the essential insights even from large datasets and monitor forecasts.
Take control of the big picture
Track both operational activities and business metrics. Master the entire reporting palette and gain a better understanding of the overall picture.
Profitability
Know which project, service, or customer is profitable and why. Also, examine the profitability development of individuals, teams, or cost centers.
Key Performance Indicators
Examine the KPIs you desire over different time periods. Choose the level of specification and the specific metrics you want to monitor. Set these data on your own desktop for easy access.
Offers
Always be informed about the status of your proposals. You can see the offers, their amounts, statuses, and estimated acceptance dates.
Invoicing
Visually track the invoicing progress and billing forecasts. Stay up-to-date on what has been invoiced from projects and what is yet to be invoiced.
Working hours
Get a detailed list of working hours and expenses per person, per role, or per project. Compare the actuals to the project objectives.
Resource allocation
Plan and monitor workloads by clients, business areas, roles, or individuals.
Gain confidence in decision-making
Forget guesswork and make fact-based decisions. Monitor up-to-date profitability reports and steer operations with reliable forecasts.
Anticipate sales and resource needs
Track your offer pipeline and anticipate billing through sales forecasts. Align future orders with resources and know when to hire additional experts.
Optimize key metrics
Set sales and project-specific goals and track results through key performance indicators (KPIs). Understand where operations can be streamlined or modified.
Lead through forecasts
Monitor real-time profitability reports and guide your business with reliable forecasts. Utilize forecasts in your leadership team’s work.

![]()
Severa is clearly superior in sales, execution, and productivity planning, monitoring, and forecasting.
Jari Danielsson – CEO, Kuudes Oy
Achieve goals
Severa’s goal setting automates the data collection related to goal progression. Set goals for your business and projects, and track results in one view.
Integrate with reporting and BI solutions
Enhance Severa’s reporting with other software. Easily connect Severa with leading reporting and Business Intelligence (BI) software through ready-made integrations..
Try Severa. Join the growing community.
We observed that companies using Severa experienced a 3.5 times faster revenue growth and 1.3 times better profitability compared to other professional service firms..